I'm a software developer with a background in finance (traded my first stock at 14) who modified a web scraper I previously built to understand why the company managing my condominium trades at 38 times earnings.
I own a condo in Chicago's West Loop. The building is managed by FirstService Residential, or FSR — a subsidiary of FirstService Corporation (NASDAQ: FSV / TSX: FSV), a Canadian company currently valued at approximately $6.2 billion. Last year I wrote about my experience with FSR's management of my building. That article raised questions. The data I've pulled since then raises more.
FirstService trades at roughly 38 times trailing earnings and 14 times EV/EBITDA — a premium you'd expect on a high-margin tech company, not a property management and home services business. Revenue has more than doubled since 2019. But when I started digging into the SEC filings, the margins, the acquisition spending, and the regional subsidiary structure, the story underneath looked very different from the one being told to investors.
When I realized that FirstService Residential operates across more than two dozen states and provinces — each with its own website, its own press release archive, its own narrative of expansion — I did what any developer would do. I wrote code to measure it.
The question was simple: Is my building an anomaly, or is this how the machine works?
The Public Story
On the surface, FirstService Corporation is a compelling business. Headquartered in Toronto and dual-listed on both NASDAQ and the TSX, the company reported $5.5 billion in revenue for fiscal year 2025. Revenue has more than doubled since 2019, growing at a compound annual rate exceeding 14%. The stock trades at approximately $134 per share.
The company operates two segments. FirstService Residential manages condominiums, homeowner associations, and co-ops — what the company calls "community association management." This segment generated $2.29 billion in revenue in 2025, roughly 42% of the total. FirstService Brands operates restoration, roofing, painting, and fire protection franchises and company-owned operations under names like Paul Davis, CertaPro Painters, Floor Coverings International, and California Closets, generating $3.21 billion, the remaining 58%.
The investor presentation language is polished. The April 2026 investor deck alone uses phrases like "essential, outsourced property services," "recurring revenue," "highly fragmented" markets, and "market leadership" in its opening pages. The company positions itself as a consolidator of fragmented service industries — a proven playbook in private equity that, when executed well, delivers compounding returns as fixed costs get spread across a growing revenue base.
Analysts have largely embraced this framing. FSV is described as a "compounder" — a company that reinvests earnings into growth and compounds shareholder value over time. The market prices it accordingly: roughly 38 times trailing earnings and approximately 14 times EV/EBITDA. These are multiples you would normally associate with a high-margin, high-growth technology company, not a property management and home services business.
The stock has rewarded believers. From 2019 through early 2025, shares roughly tripled. But the question I kept returning to, as both a condo owner and someone with a finance background, was whether the underlying business justified the valuation — or whether the market was pricing a story that the numbers don't support.
When you pull seven years of annual reports and lay the financials side by side, what you find is something different from the story being told.
The Numbers Don't Compound
Margins are flat
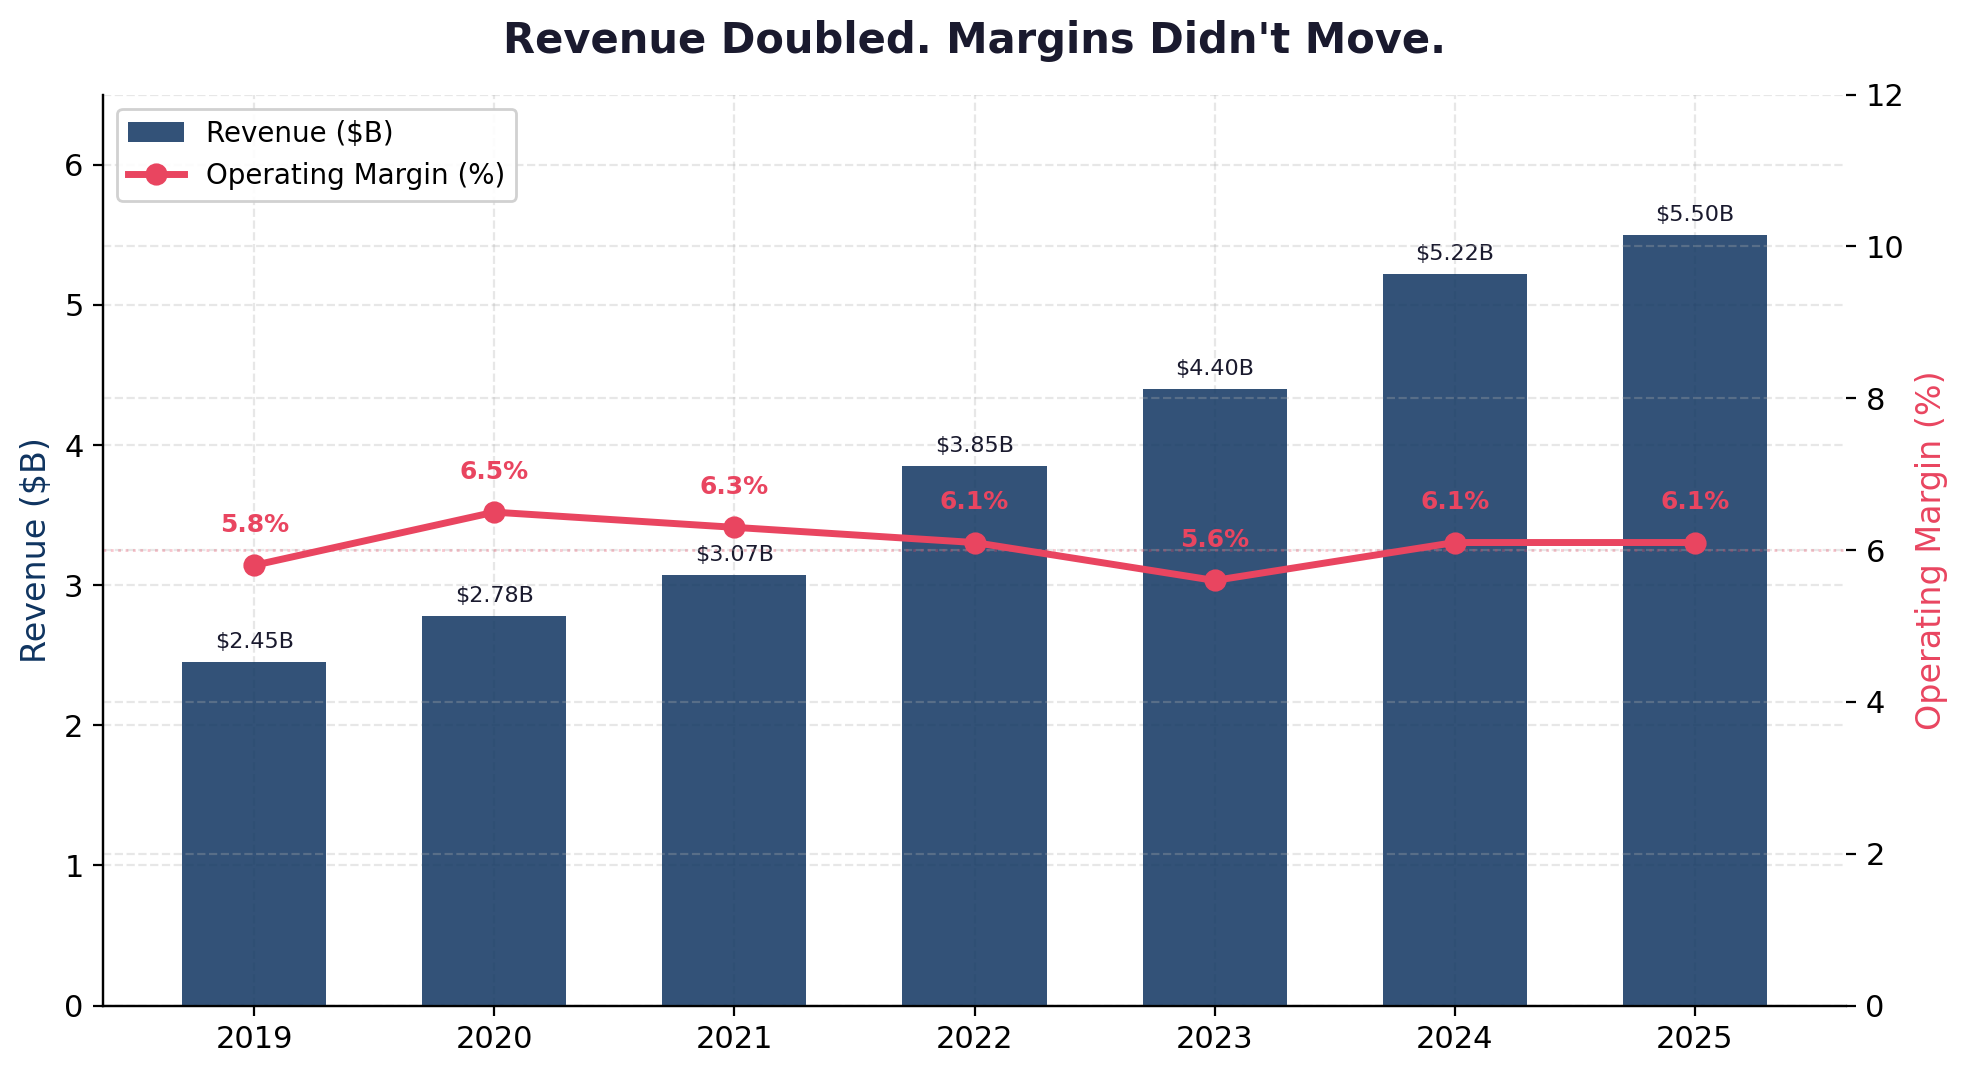
A true compounder demonstrates operating leverage. Revenue grows, fixed costs get absorbed, and margins expand over time. At FirstService, revenue doubled from $2.45 billion in 2019 to $5.50 billion in 2025. Operating margin over that same period moved from approximately 5.8% to 6.1%. Seven years of doubling revenue with essentially no margin expansion.
For context, the average operating margin across the seven-year span ranged between 5.6% and 6.5%. That is not the profile of a business achieving scale advantages. It is the profile of a business where every new dollar of revenue requires nearly a dollar of associated cost.
| Year | Revenue ($B) | Operating Income ($M) | Operating Margin |
|---|---|---|---|
| 2019 | $2.45 | $142 | 5.8% |
| 2020 | $2.78 | $181 | 6.5% |
| 2021 | $3.07 | $194 | 6.3% |
| 2022 | $3.85 | $234 | 6.1% |
| 2023 | $4.40 | $247 | 5.6% |
| 2024 | $5.22 | $317 | 6.1% |
| 2025 | $5.50 | $336 | 6.1% |
Why does this matter? Because margin expansion is the financial signature of a real compounder. It is how you differentiate a company that is scaling efficiently from one that is simply getting bigger. Walmart compounds. A franchise that opens a new location every month at the same unit economics does not — it just grows.
To see what operating leverage actually looks like, compare FirstService to Rollins, Inc. (NYSE: ROL), a pest control services roll-up that also trades at a premium. Rollins reported a 19.3% operating margin in FY 2025 on $3.76 billion in revenue — more than triple FirstService's ~6%. Rollins also does something FirstService does not: it discloses organic versus acquired revenue growth. In 2025, Rollins grew organically at 6.9% and added 4.1% from acquisitions. Investors can see exactly what they're paying for. FirstService provides no such breakdown.
Or compare to ABM Industries (NYSE: ABM), a much closer operational comparable in facility services, which trades at roughly 12.5 times EV/EBITDA — not 14. ABM's lower multiple reflects the reality that services businesses with thin margins are not typically awarded premium valuations. FirstService currently defies that norm.
Growth is bought, not earned
Between 2019 and 2025, FirstService spent approximately $1.76 billion on acquisitions. Revenue grew by $3.1 billion in the same period. The company does not disclose what portion of its growth is organic versus acquired. This is a material omission for a company priced as a high-quality compounder.
What we do know comes from a disclosure buried in the notes of the 2025 annual filing (40-F, page 5). One of FirstService's reporting units triggered an interim goodwill impairment review in Q4 2025. The stated reason: "declining organic revenue." A company trading at 38 times earnings had a business unit with declining organic revenue — and this fact appears only in a technical accounting note.
Without clear organic growth disclosure, we can estimate. If acquisitions were completed at 1.0 to 1.5 times revenue (typical for services roll-ups), the $1.76 billion in acquisition spending would account for $1.76 to $2.64 billion of the $3.1 billion revenue increase. That implies organic revenue in 2025 of roughly $2.86 to $3.74 billion — an organic CAGR of approximately 2.6% to 7.3%. In plain terms: take the total revenue growth, subtract the revenue that came with purchased companies, and what's left is what the business grew on its own. That remainder — the organic piece — may be as low as inflation-level growth. That is a very different growth profile than the headline 14%+ CAGR investors see.
Consider what this means. At the low end of the organic estimate, FirstService's real growth rate is barely keeping pace with inflation. The premium valuation would be resting almost entirely on acquired growth — growth funded by debt and equity, not by winning new customers or delivering better service to existing ones.
The balance sheet tells the story
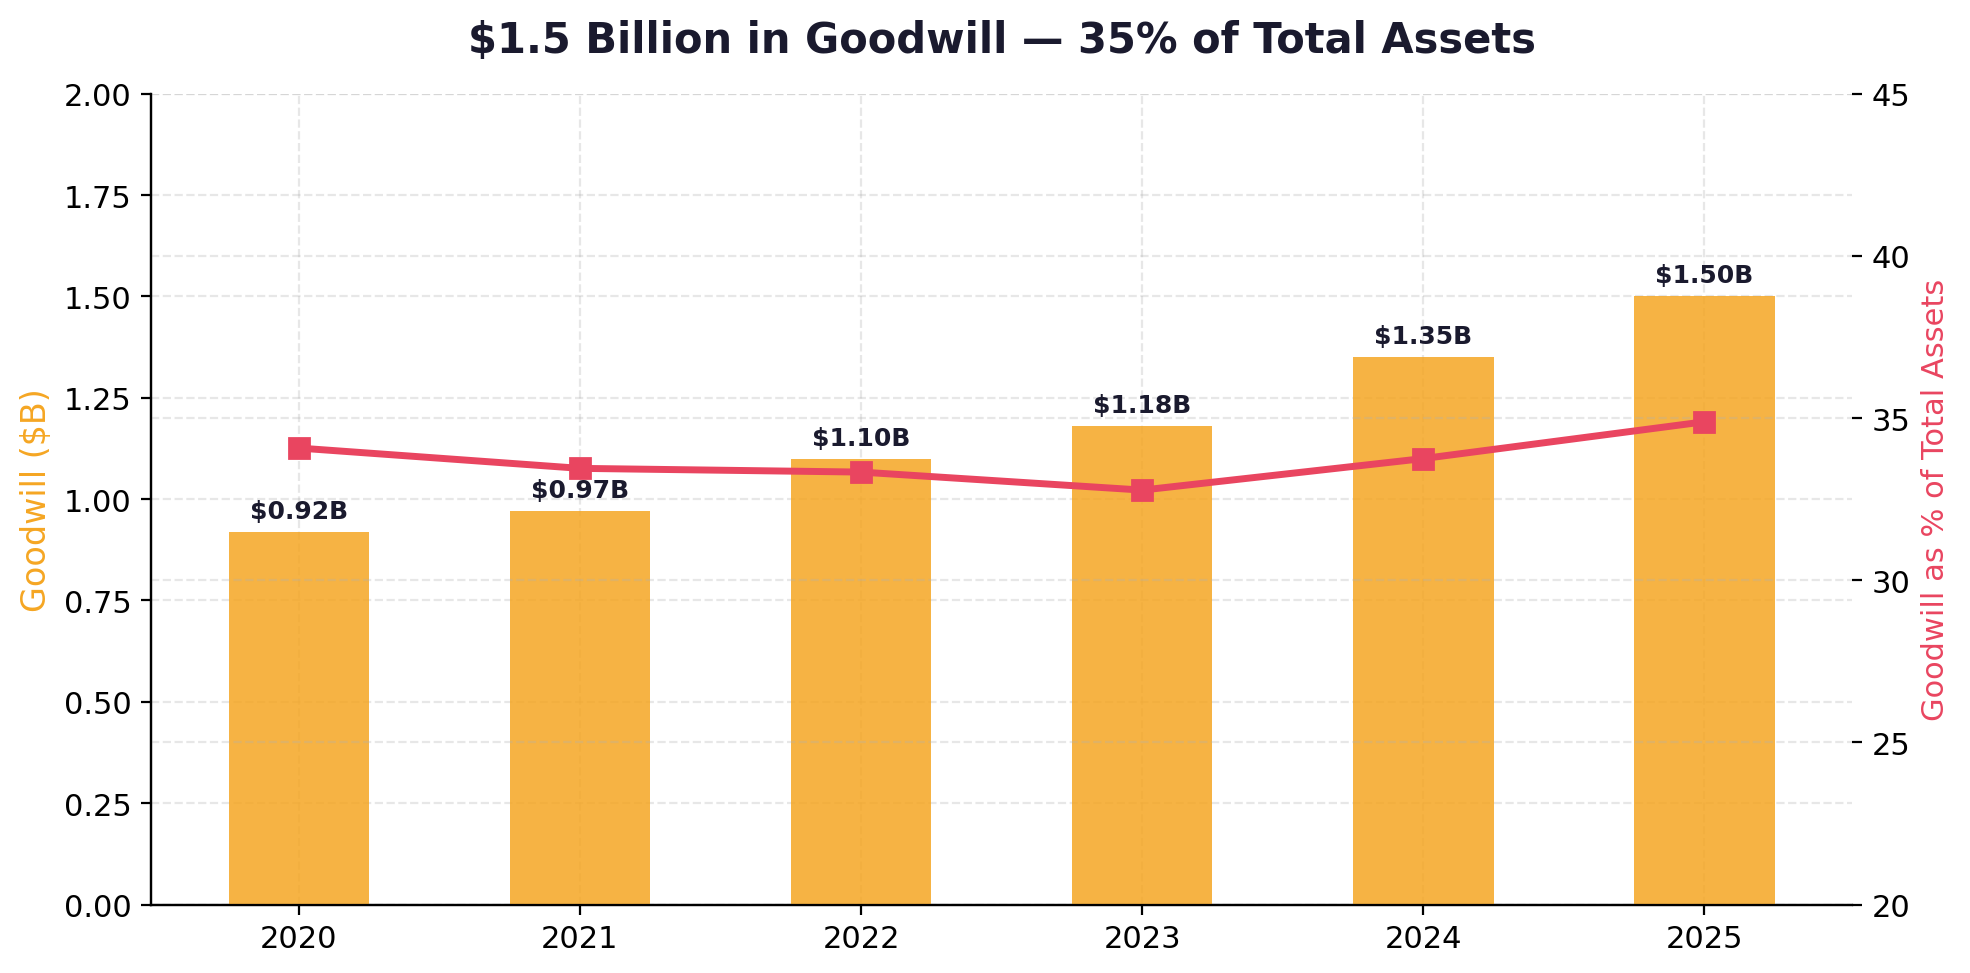
Goodwill on the balance sheet has grown from $1.18 billion in 2023 to $1.50 billion in 2025. At $1.5 billion, goodwill represents 35% of total assets. This is the accumulated premium paid for acquired businesses above their tangible asset value — and it only grows if acquisitions continue.
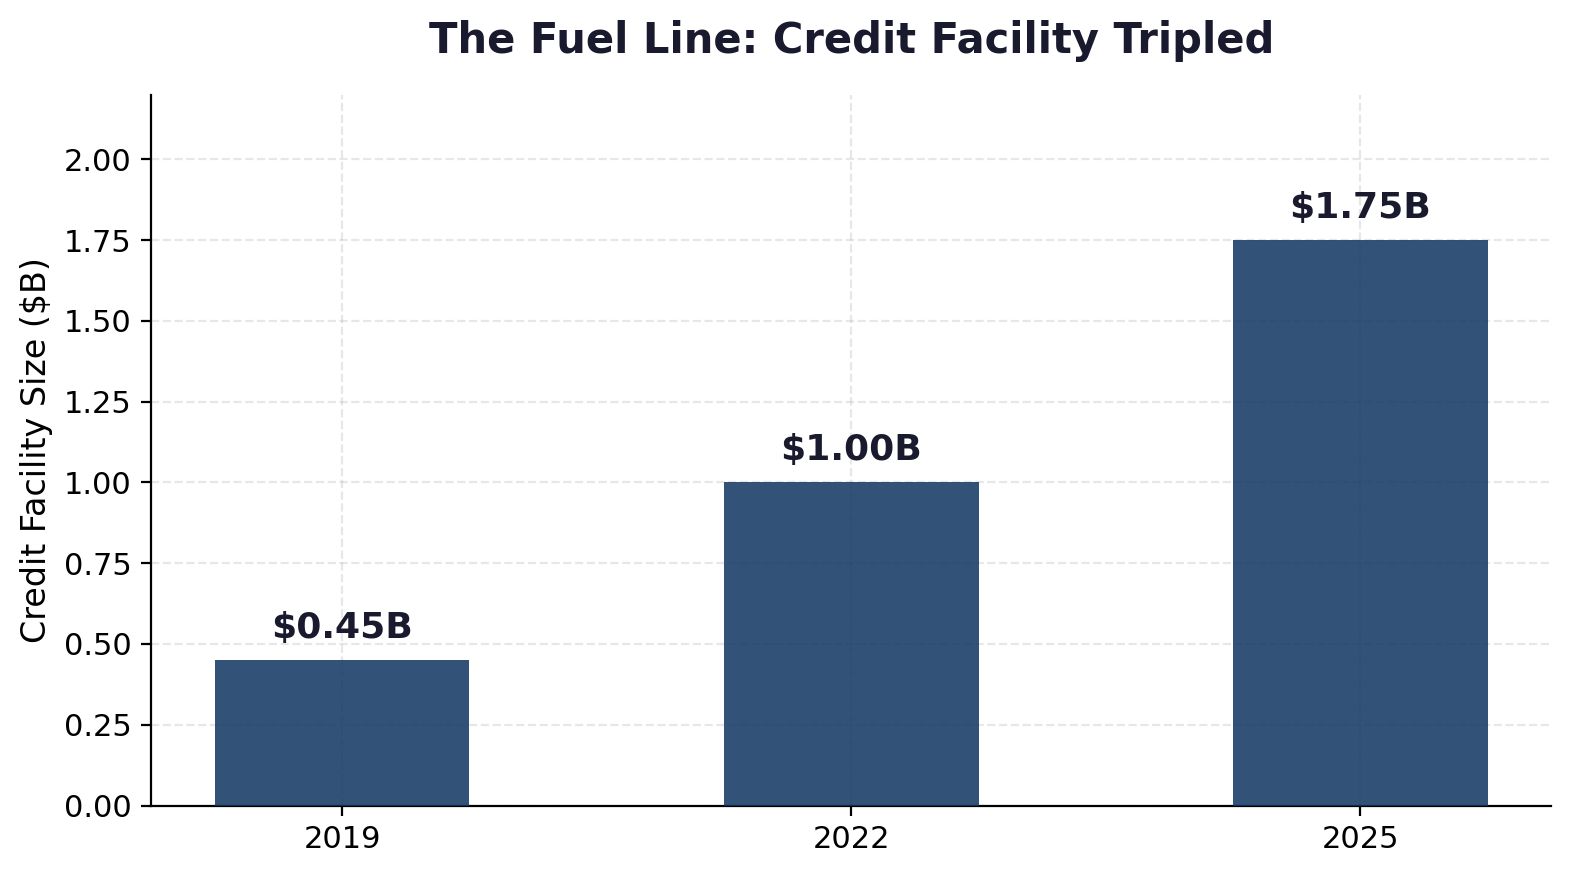
Total debt stands at $1.08 billion. The company's revolving credit facility has tripled: $450 million in 2019, expanded to $1.0 billion in 2022, then to $1.75 billion in 2025. Each expansion was accompanied by SEC filings documenting the amended credit agreement — you can trace the progression through F-10 registrations and 6-K filings.
The cost of that debt has risen materially. According to the company's 40-F annual filings, interest rates on the company's senior notes climbed from 3.84% to 4.53% in 2022, then to 5.64% by 2024. The weighted average interest rate across all borrowings rose from 6.29% in 2023 to 7.0% in 2024, before easing slightly to 6.3% in 2025 after the company extended its revolving credit maturity from February 2027 to February 2030. Total interest expense tells the story most clearly: approximately $25 million in 2022, $49.7 million in 2023, $77.4 million in 2024, and $73.3 million in 2025. In three years, interest costs tripled — eroding the earnings that support a 38x multiple. The company's interest rate swaps, which were a $3.9 million asset in 2024, flipped to a $911,000 liability in 2025 — a small but telling shift in hedging position.
This is not a company funding growth from excess cash flow. This is a company that has systematically expanded its borrowing capacity to fund acquisitions — and the cost of that borrowing has risen sharply. The revolving facility is the fuel line. When it stops expanding — or when the terms tighten further — the acquisition pace must slow. And when the acquisition pace slows, the headline growth rate falls, as we may already be seeing in 2025.
Revenue growth is decelerating
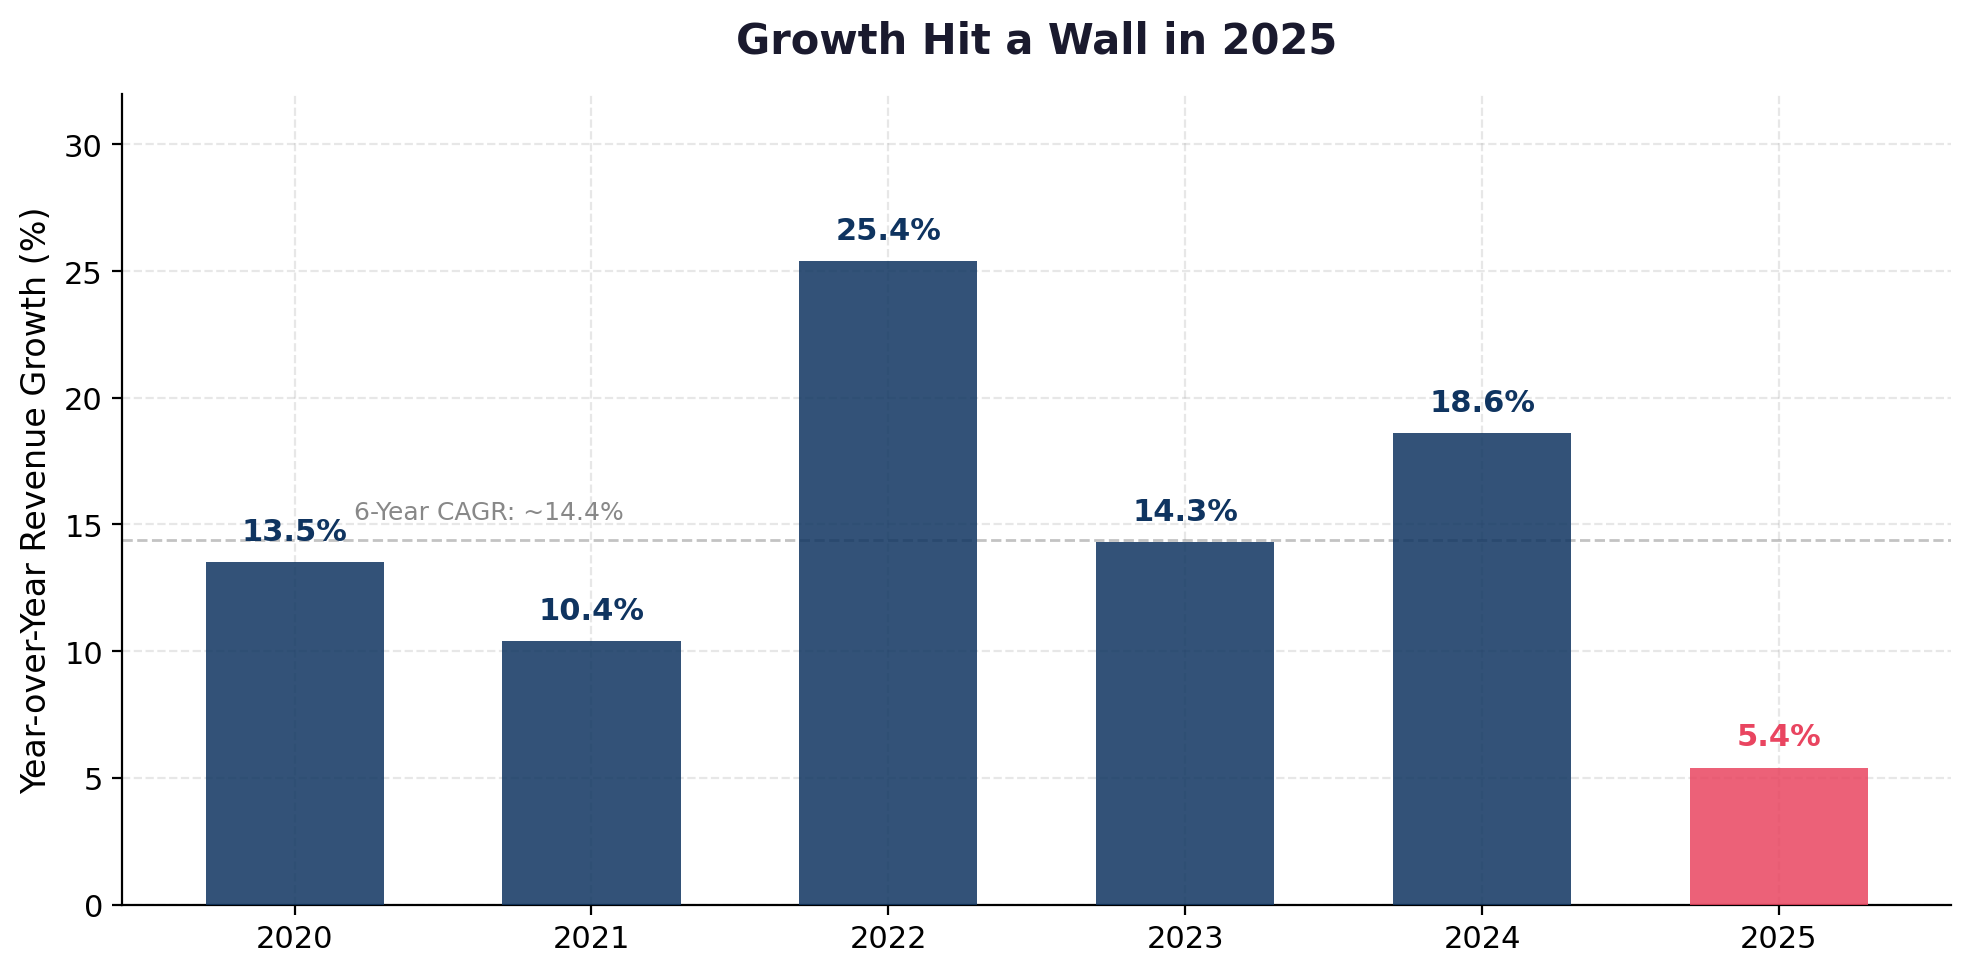
Revenue growth hit 18.6% in 2024. In 2025, it dropped to 5.4%. That is a dramatic deceleration — from industry-leading growth to barely above inflation in a single year.
| Year | Revenue ($B) | YoY Growth |
|---|---|---|
| 2020 | $2.78 | +13.5% |
| 2021 | $3.07 | +10.4% |
| 2022 | $3.85 | +25.4% |
| 2023 | $4.40 | +14.3% |
| 2024 | $5.22 | +18.6% |
| 2025 | $5.50 | +5.4% |
The acquisition engine that drove the headline growth rate appears to be slowing. Whether that is a function of larger base effects, reduced target availability, integration challenges, rising borrowing costs that make acquisitions more expensive to finance, or a pullback in capital deployment is unclear. What is clear is that the 14%+ compound growth rate is a backward-looking number, and the most recent year tells a materially different story. A stock priced for consistent double-digit growth needs to deliver it — and a single year at 5.4% raises questions about whether the machine can sustain its pace.
The Second Layer
This is where things got interesting — and where I hadn't seen any analyst go.
The parent company, FirstService Corporation, reports acquisitions in its SEC filings and occasional press releases. These are the transactions that show up on investor radar — named deals, announced on GlobeNewswire, sometimes accompanied by a purchase price. But FirstService Residential — the property management subsidiary — maintains its own regional press release archives across 26 states and provinces, each with its own expansion narrative running largely independent of the parent-level story.
I discovered this structure while browsing FSR's Illinois website — the site for the region managing my building. There was a press release archive with years of announcements about portfolio additions, new communities, and expansion activity. I checked another state. Same thing. And another. Each regional site had its own archive, its own press releases, its own expansion story — running in parallel to, but separate from, anything disclosed at the parent company level.
So I used a modified Rust web scraper to systematically collect the data. Across 26 regional FSR websites, I pulled 1,813 press releases. Of those, 918 matched keywords associated with acquisitions, portfolio additions, and geographic expansion.
The language patterns are revealing. The word "portfolio" appears in 279 releases. "Management portfolio" — as in, the number of communities under management — appears 95 times. "Expands" shows up 64 times. "Partnership" 63 times. Explicit acquisition language ("acquired," "acquires," "acquisition") appears across 32 releases. The phrase "market leadership" is used 25 times.
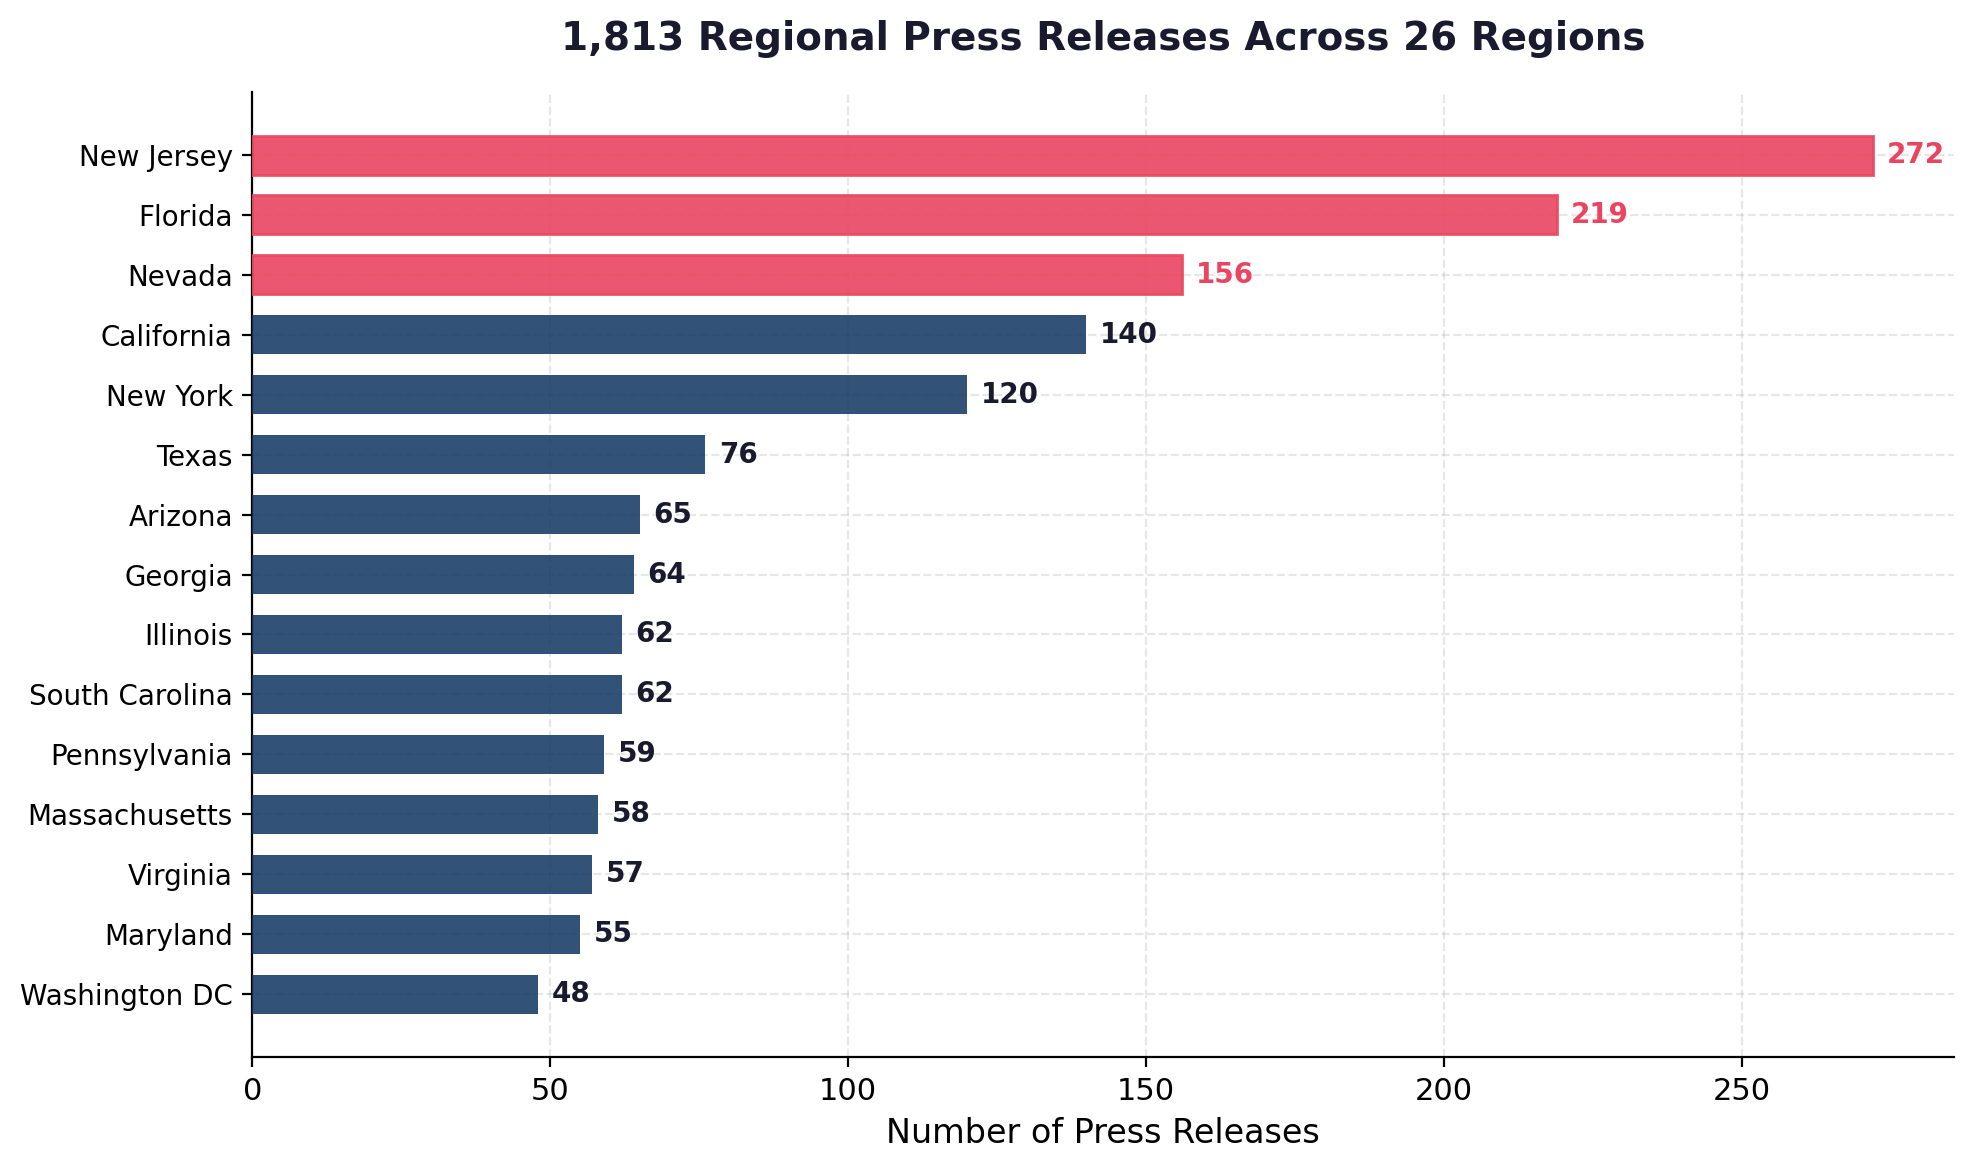
The regional concentration tells its own story. In New Jersey alone, 68% of the 272 releases matched acquisition-related keywords:
| Region | Total Releases |
|---|---|
| New Jersey | 272 |
| Florida | 219 |
| Nevada | 156 |
| California | 140 |
| New York | 120 |
| Texas | 76 |
| Arizona | 65 |
| Georgia | 64 |
| Illinois | 62 |
| South Carolina | 62 |
These press releases span from 2012 through 2026, with consistent annual volume: 158 releases in 2019, 173 in 2020, 158 in 2021, 169 in 2022, 190 in 2023. Each one describes a local portfolio addition, a new community brought under management, or a geographic expansion — often without any corresponding announcement at the parent company level.
The examples are specific. In February 2019, FSR announced it was "expanding its Chicago property management portfolio with the acquisition of Lieberman Management Services," while simultaneously absorbing the condominium management division of Draper and Kramer — that is how FSR entered my market. The personnel pipeline is visible: Brian Butler, formerly of Lieberman Management, is now President of FirstService Residential Illinois. Ian Novak, formerly of Draper and Kramer, is now Vice President of Property Management at FSR Illinois. Both now appear on FSR's Illinois leadership page. The acquired companies' clients didn't choose FSR. The contract moved; the people followed. In California, they acquired Bruner & Rosi Management in 2016, adding more than 40 homeowner associations. In Minnesota, they acquired Laukka Management (2014) and Paradise & Associates (2017), each time absorbing the target's portfolio of community clients. In New York, they acquired Charles H. Greenthal & Co. and Tudor Realty Services in 2023, described as adding "portfolios of marquee properties." Each of these was announced on the regional FSR site. None of them required a parent-level press release.
On FSR's own corporate podcast, company president Michael Mendillo describes his role as being "responsible for identifying, due diligence and negotiation of all regional acquisitions" (noted at the bottom of the episode page) and claims involvement in "24 such strategic acquisitions." This is the company's own executive, on the company's own podcast, describing a continuous acquisition apparatus at the subsidiary level that most investors never see.
The insight is structural. What appears at the parent-company level as a clean two-segment business is, underneath, a continuously expanding network of regional entities, management portfolio additions, and local consolidation activity. It is a roll-up beneath the roll-up. Most investors reading the annual filing would never encounter this layer. The regional sites reveal the machinery — and the scale of it.
The Customer Experience Gap
If the acquisition machine is the engine, the question becomes: what is the product? The data suggests that for FirstService Residential, the product may not be management quality. It may be management contracts — and the structural switching costs that keep them in place.
My own experience is a data point. My building's board renewed FSR's contract — worth upward of $80,000 per year — without soliciting competitive bids. I asked the board for evidence that alternatives had been evaluated. None was provided.
The law firm advising my condo association is Kovitz Shifrin Nesbit. On FirstService Residential's own Illinois website, KSN Principal Kerry Bartell is listed as a "legal expert guest speaker" at FSR's 2025 Board Orientation — an event designed to train the boards that FSR manages. KSN attorney Joshua Weinstein has also appeared at FSR-hosted events, including as a legal panelist at FSR's 2023 Illinois Board Forum. The firm that educates boards at the management company's own events is also the firm that represents the association managed by that same company. The relationship is documented on FSR's own website — readers can assess the dynamic themselves.
KSN itself carries 46 reviews on Yelp with consistently low ratings from clients who describe adversarial billing practices and poor responsiveness.
But my building is not unique. Across public review platforms, the pattern repeats:
FirstService Residential carries a 2-star average across more than 1,500 reviews on Yelp. On PissedConsumer, the average is 1.2 stars across 54 reviews. Individual FSR office locations tell the same story: 76 reviews in Miami, 72 in New York, 15 in St. Petersburg — across cities and states, the service complaints are consistent. Unresponsive management, poor maintenance follow-through, opaque billing, difficulty reaching assigned managers. The pattern extends to the Better Business Bureau, where FSR offices across Illinois, Florida, Minnesota, New York, Georgia, Maryland, and California carry separate profiles with complaint histories — the geographic breadth of the complaints mirrors the geographic breadth of the acquisitions.
This is not isolated to one building or one city. It is a pattern that spans the same geographic footprint where those 1,813 regional press releases announce portfolio growth.
Independent voices corroborate this. Brianna Bates, a lawyer and policy advocate, published an independent analysis of her own experience with FirstService Residential — at a different building, in a different city. Her conclusions align with mine despite having no contact with me prior to publication. She describes the same structural dynamics: captured boards, vendor gatekeeping, and a system where the manager's interests diverge from the residents' interests. When a lawyer and a software developer independently arrive at the same conclusions about the same company from entirely different geographies, that is a signal worth noting.
The structural question for investors is this: if service quality is consistently poor across markets, what sustains the premium? The answer may be that portfolio scale — not service quality — is the product being sold. The roll-up machine acquires management contracts, and the switching costs (board inertia, no-bid renewals, embedded advisory relationships) keep those contracts sticky. For a company priced at 38 times earnings, investors are paying for durability. But the source of that durability is not customer satisfaction. It is friction.
What Is FSV Actually Worth?
If FirstService Corporation is not a high-growth compounder with operating leverage but rather an acquisition-driven roll-up with flat margins, decelerating growth, and a product moat built on switching costs rather than quality — then the current valuation requires examination.
EV/EBITDA approach
EBITDA for fiscal 2025 was approximately $523 million.
ABM Industries, a comparable facility services company, trades at roughly 12.5 times EV/EBITDA. Applying that multiple to FSV yields an implied share price of approximately $107. A more typical services roll-up multiple of 10 times implies approximately $84 per share. A private-market valuation at 8 times — where a buyer would account for integration risk, goodwill, and leverage — implies roughly $61.
P/E approach
Trailing earnings per share were approximately $3.55.
At 25 times earnings — a generous multiple for a quality services business — the implied price is approximately $89. At 30 times — giving credit for the brand portfolio and market position — the price is roughly $107. The current market assigns 38 times, implying approximately $134.
The range
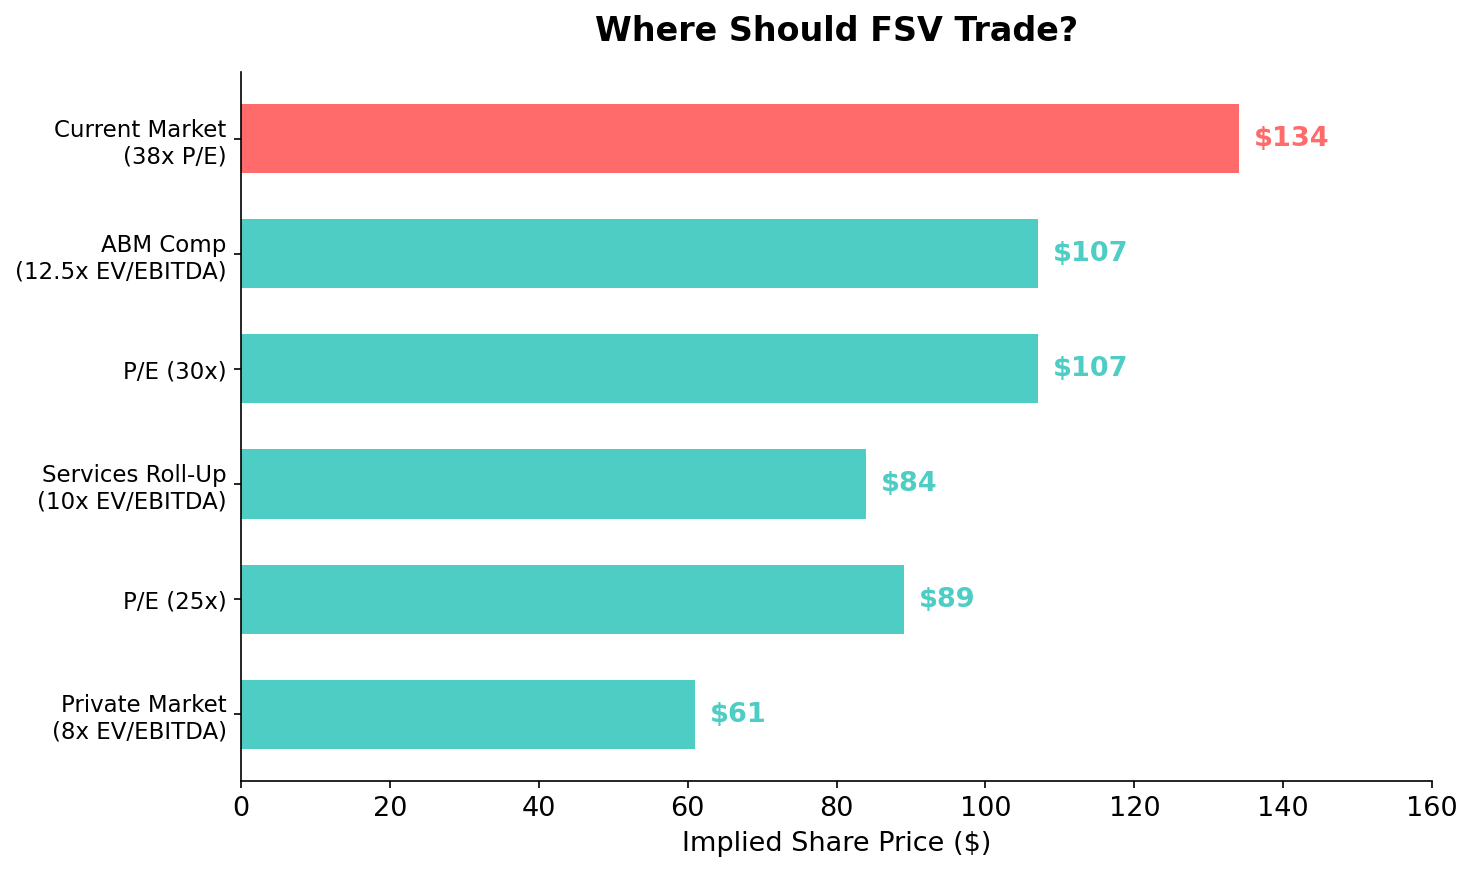
| Method | Multiple | Implied Price |
|---|---|---|
| EV/EBITDA (ABM comp) | 12.5x | ~$107 |
| EV/EBITDA (services roll-up) | 10x | ~$84 |
| EV/EBITDA (private market) | 8x | ~$61 |
| P/E (quality services) | 25x | ~$89 |
| P/E (generous) | 30x | ~$107 |
| Current market | 38x | ~$134 |
A blended fair value range of $84 to $107 implies 20% to 37% downside from the current price.
To be clear about what these numbers represent: this is not a prediction. It is a comparison of what the market currently pays versus what comparable companies trade for — and an observation that the gap is wide. A 38x P/E requires the market to believe that either growth will re-accelerate significantly, margins will expand, or both. Seven years of data suggest neither is happening.
The key risk to this thesis is straightforward: if FirstService demonstrates organic growth acceleration and margin expansion, a higher multiple is warranted. If the company can sustain its acquisition pace while improving integration and operational efficiency, the premium may be justified. The current data does not support that scenario. Revenue growth has decelerated sharply, margins have not expanded in seven years, and the one organic growth disclosure in the annual filing describes decline, not acceleration.
The Structural Questions
These are the questions that the data raises — and the ones I think large shareholders and covering analysts should be asking.
How manageable is this level of operational complexity across 26 or more regions, each with its own portfolio additions, local partnerships, and expansion activity? How dependent is revenue growth on continued acquisition? What happens to the growth story when the pipeline slows — as the 2025 revenue deceleration may suggest?
How visible are the regional subsidiary activities to investors who only read the 40-F? The parent-level filing describes two clean segments. The regional press release archives reveal a sprawling, continuously expanding network of portfolio additions. Does the market fully understand this operational structure?
Why doesn't FirstService disclose organic versus acquired revenue growth? For a company at this valuation, the omission is notable. What would the stock price be if investors knew the true organic growth rate?
And finally: what is the real customer retention rate when the switching costs — board inertia, no-bid contract renewals, embedded legal and advisory relationships — are removed? If unit owners could easily evaluate and replace their management company, would retention rates hold?
These are not rhetorical questions. They are the questions that would need answers before one could justify paying 38 times earnings for this business. I have not seen them addressed in any analyst report or investor presentation.
Conclusion
I started this as a condo owner who noticed his building's management company was publicly traded. I now live in Montevideo, Uruguay — thousands of miles from the building I still own and the management company still running it. But distance gives perspective. What began as curiosity turned into mapping a $6.2 billion company's expansion network across 26 regions, pulling six years of SEC filings, modifying a web scraper to collect 1,813 regional press releases, and building a financial case for a valuation gap the market may not see.
The most interesting discovery was not any single acquisition or any single data point. It was structural: beneath the publicly traded company that presents itself as a clean, two-segment essential-services compounder, there exists an enormous and continuously expanding network of regional entities, management portfolios, and franchise operations — largely invisible to the investors who price the stock.
The financial case is straightforward. Revenue growth has been driven primarily by acquisitions, not organic demand. Operating margins have not expanded. The balance sheet carries $1.5 billion in goodwill. The credit facility has tripled. Revenue growth has decelerated sharply. And one reporting unit's organic revenue is declining, a fact disclosed only in an accounting note.
The human case is also straightforward. The people living inside the properties this company manages — across multiple states, multiple cities, multiple buildings — consistently describe poor service. The structures that keep management contracts in place appear to rely more on friction and embedded relationships than on quality.
Whether this adds up to overvaluation is a question each investor must answer for themselves. Everything I've cited is public. The regional press releases live on FSR's own websites. The SEC filings are searchable. The reviews are on Yelp. The podcast is on FSR's site. I've tried to present it all accurately and let the data speak.
If you're a shareholder, I'd encourage you to read the 40-F in full — including the goodwill impairment note on page 5. Browse a few of the regional FSR websites. Search Yelp for "FirstService Residential" in the cities where you believe this company is building durable value.
This is not investment advice. This is one condo owner's attempt to understand the system — and to measure whether the market sees what he sees.
If you have had your own experience with FirstService Residential and want to share it, you can find me on Medium or LinkedIn.
Sources & Data
SEC Filings
- FirstService Corporation 40-F Annual Reports (2020-2025), filed with SEC
- FirstService Corporation 6-K Quarterly Earnings (2021-2026 Q1)
Company Sources
- FSR 2025 Illinois Board Orientation — features KSN attorneys as speakers
- FSR Get on Board Podcast, Episode 2.1 — Michael Mendillo on acquisition strategy
Data & Code
- Rust Web Scraper (modified) — used to collect regional press releases
- Regional press release dataset: 1,813 releases across 26 regions, 918 keyword-matched
Previous Reporting
- Colin Rhys, "When the System Fails Condo Owners", colinrhys.io, June 2025
- Brianna Lee Bates, "Why 1150 K Street NW + FSR Are Failing A Condo Community", Case by Case / Medium, November 2024
Review Data
- FirstService Residential — Yelp: 2 stars / 1,500+ reviews (brand aggregate page)
- FirstService Residential — PissedConsumer: 1.2 stars / 54 reviews
- Kovitz Shifrin Nesbit — Yelp: 46 reviews
- FirstService Residential — BBB Search: multiple regional profiles
Leadership & Acquisitions
- FSR Illinois Leadership
- Brian Butler — LinkedIn (ex-Lieberman Management → FSR Illinois President)
- Ian Novak — LinkedIn (ex-Draper and Kramer → FSR Illinois VP)
Comparable Companies
Disclaimer: This article represents independent research and personal opinion. It is not investment advice. The author owns a condominium managed by FirstService Residential and has no position in FSV stock. All data cited is from public sources. Readers should conduct their own due diligence before making investment decisions.